Dashboard overview
When you open your Sales Hub, the first thing you’ll see is your dashboard. The dashboard is there to give you vital information about your sales at a glance.
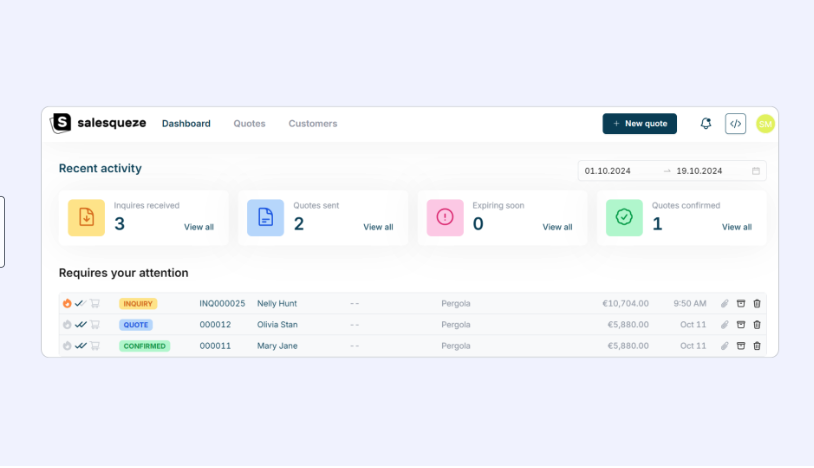
The dashboard displays a count of all inquiries received, quotes sent, expiring soon, and quotes confirmed in a given time period. By default, this is set to the past week, but you can adjust the time filter differently if you prefer (in the screenshot, month-to-date view is displayed). Click on View all under each counter to open the corresponding inbox folder (Inbox, Sent, Expiring soon, Confirmed).
Requires your attention
You’ll also see a list of inbound inquiries, quote responses, and messages that have been assigned to you and require your attention. This lets you jump straight in without having to dig through each inbox folder.
Monthly statistics
Scroll to the bottom of the dashboard to see your monthly statistics. It gives you quick high-level insight into your business performance and growth.
Two default insights are displayed:
- Quotes by month: bar chart showing a tally of all monthly quotes created, prepared, and confirmed.
- Visitors and page views: line chart showing how many individual customers visited your configurator and how many page views they had in total.
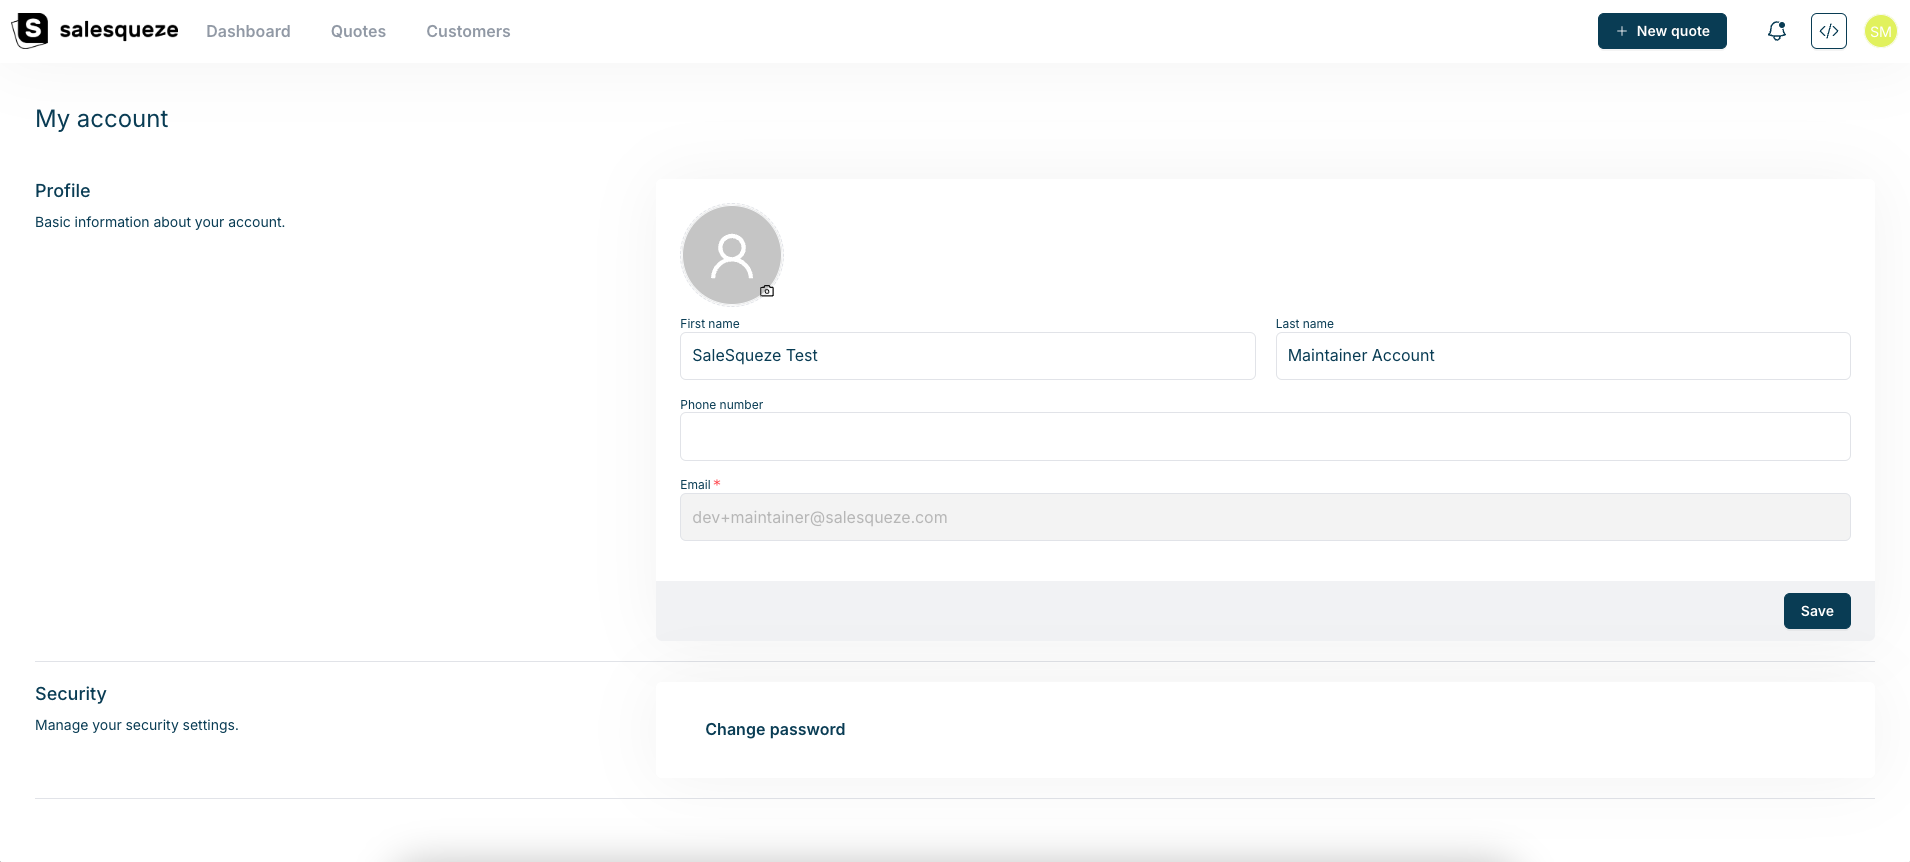
Your account
You can access and edit your account information or Log out with clicking on circle in right upper corner:
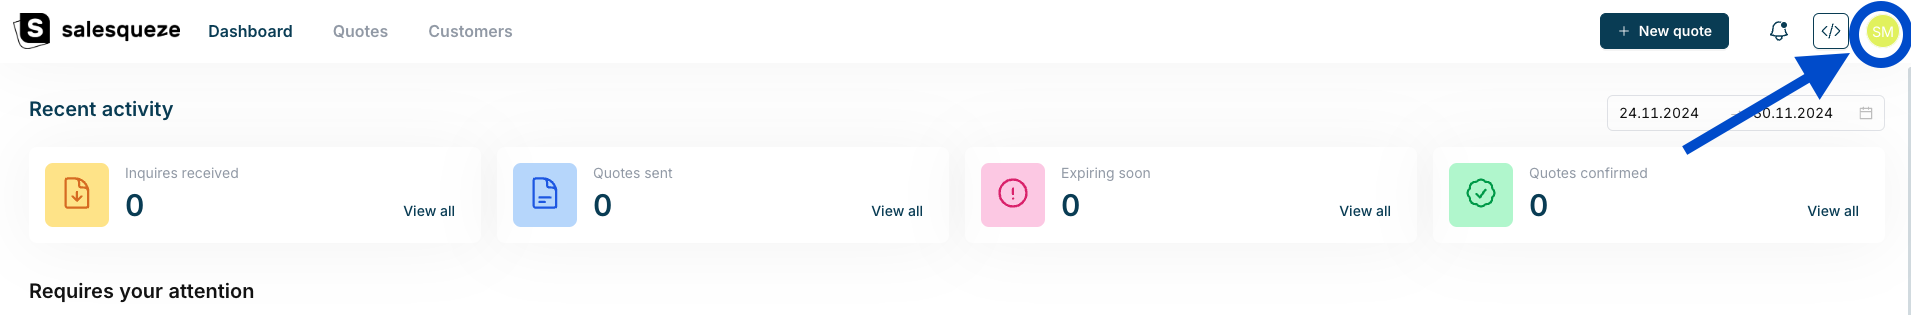
You can edit your data or change password, if needed.
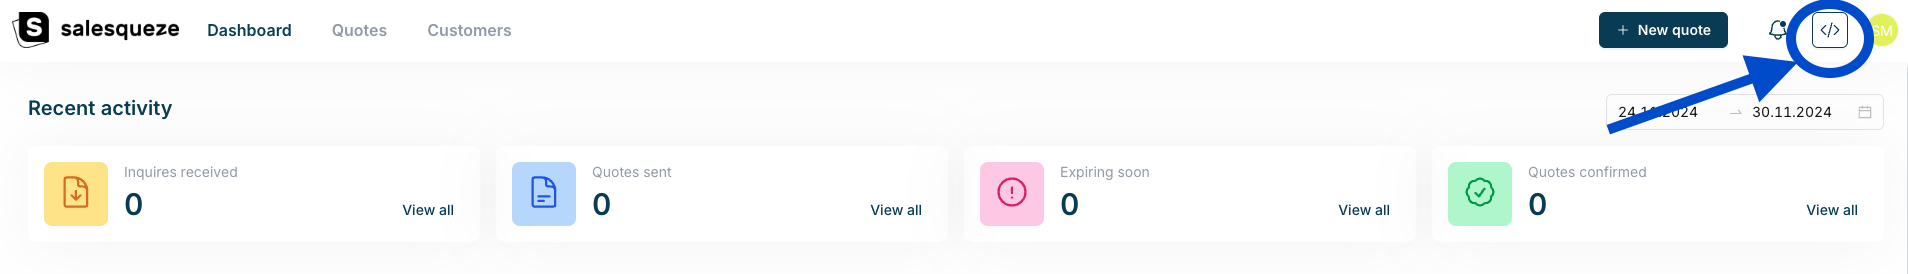
Access to Studio
You can easily access Studio from Sales Hub with clicking second icon from right in the upper corner: